
Staying ahead of the curve in today’s quickly changing economic scene necessitates access to accurate and timely information. Economic indicators serve as important guideposts, directing decision-making and offering insight into the health and direction of economies. Businesses, governments, investors, and researchers now have a formidable tool at their disposal thanks to the Economic Indicators API. This API provides customers with access to a plethora of real-time and historical data on important economic variables. Allowing them to study trends, identify risks, and make educated decisions. Using the Economic Indicators API opens up a world of possibilities, whether you’re an economist deciphering the nuances of inflation. A policymaker crafting fiscal plans, or an investor looking to maximize portfolio performance.

The Most Common Applications Of An API For Economic Indicators
- Economic Analysis: The API may use by researchers and economists to examine economic statistics. Such as inflation rates, GDP growth, unemployment rates, and other significant metrics. This information assists them in understanding the overall health and performance of an economy, identifying trends, and making sound projections.
- Policy Making: Economic indicators are use by government agencies and policymakers to design and change fiscal and monetary policies. The API offers them real-time or historical data on numerous economic indicators. Allowing policymakers to monitor the effectiveness of their policies and make data-driven policy decisions.
- Investment and Financial Decision-Making: Economic indicators are use by investors, financial institutions, and asset managers to analyze investment possibilities, manage portfolios, and make educated financial decisions. They may use the API to gain access to trustworthy and up-to-date economic data. Which allows them to monitor market conditions, detect investment risks, and optimize investment plans.
- Economic indicators are use by businesses across industries to anticipate market conditions, prepare budgets, and build strategies. Companies may obtain pertinent economic data and evaluate indicators. Such as inflation, interest rates, consumer spending, and employment trends by integrating the API into their systems.
- Risk Management and Insurance: Economic indicators are used by insurance companies, risk managers, and underwriters to measure risk levels and calculate insurance rates. They can use the API to assess market conditions, inflationary risks, and potential repercussions on insured assets or liabilities. This enables them to appropriately price insurance and efficiently manage risk exposure.
- Market Research and Forecasting: Economic indicators are used by market researchers and analysts to evaluate consumer behavior, market trends, and industry performance. They may acquire data on consumer confidence, retail sales, housing market conditions, and other elements by utilizing the API, allowing them to create data-driven market projections and strategic suggestions.
- International Comparisons and Benchmarking: The API provides users with access to economic metrics from many nations, making international comparisons and benchmarking possible. This is especially beneficial for global enterprises, investors, and organizations that need to monitor and compare economic performance across areas and economies.
Which API Provides The Best Economic Indicators?
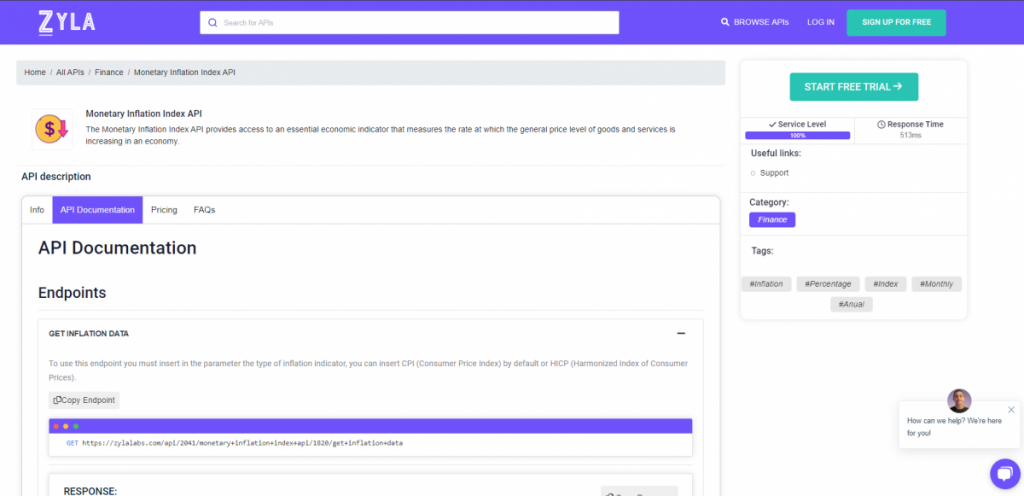
Following considerable testing, we can confidently state that the Zylalabs API is the easiest to use and gives the greatest results: Monetary Inflation Index API
In addition, the findings are delivered in JSON format!
For example, entering CPI (Consumer Price Index) or HICP (Harmonized Index of Consumer Prices) into the “Get Inflation Data” endpoint yields the following results:
[
{
    "country": "Poland",
    "type": "CPI",
    "period": "april 2023",
    "monthly_rate_pct": 0.725,
    "yearly_rate_pct": 15.252
  },
  {
    "country": "Portugal",
    "type": "CPI",
    "period": "april 2023",
    "monthly_rate_pct": 0.563,
    "yearly_rate_pct": 5.71
  },
  {
    "country": "Russia",
    "type": "CPI",
    "period": "march 2022",
    "monthly_rate_pct": 7.613,
    "yearly_rate_pct": 16.698
  {
]
What Is The Location Of This Economic Indicator API?
- To begin, go to the Monetary Inflation Index API and press the “START FREE TRIAL” button.
- After joining Zyla API Hub, you will be able to utilize the API!
- Make use of the API endpoint.
- After that, by hitting the “test endpoint” button, you may perform an API call and see the results shown on the screen.
Related Post: Is There An API For Inflation Rate Data?