If you want to get commodity data to make statistics, you should acquire the best API to do this. In this post, we are recommending the best commodity data API for statisticians to be certain in their information.
Following the Food and Agriculture Organization of the United Nations, global food raw material prices fell sharply last month, the fourth consecutive and largest monthly drop since 2008, following the lifting of the Russian blockade on Ukrainian ports, which allowed grain ships to transit the Black Sea (FAO).
In July, the index, which measures monthly fluctuations in the world’s biggest traded food commodities, averaged 140.9 points, the lowest since January and 8.6 percent lower than in June. Meanwhile, although prices continue to rise by 13.1 percent year on year, this is less than the 23.1 percent increase seen in June.
The institution warns that several uncertainties, such as high fertilizer costs, bleak global economic forecasts, and shifting exchange rates, continue to pose severe threats to world food security. The decline was mostly due to a drop in worldwide pricing for vegetable oils and grains.
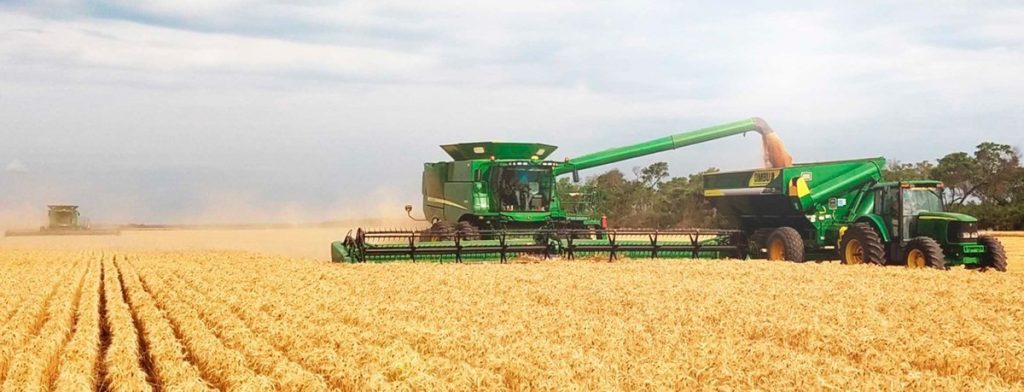
All worldwide prices declined for diverse causes, with the drop in oil prices acting as a common factor, putting downward pressure on their values. Cereal prices declined 11.5 percent monthly (after falling 4.1 percent in June), pulled down by a 14.5 percent drop in the global price of wheat, even though the statistics reached 16.6 percent and 24.8 percent above July 2021, correspondingly.
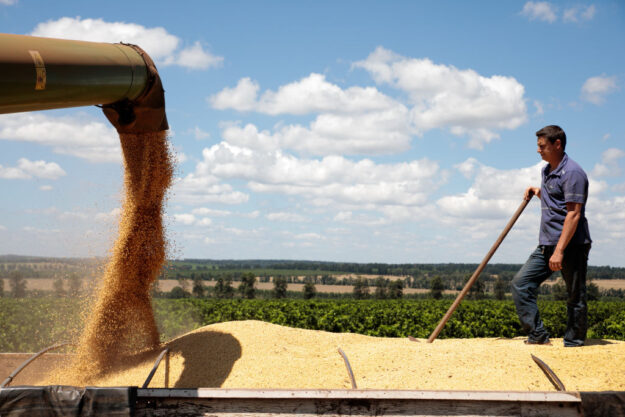
Ukraine and Russia produce over a third of the world’s cereals, and the March battle increased their worth significantly. Aside from wheat, coarse grain prices plummeted 11.2 percent and corn prices fell 10.7 percent.
In the instance of one or the other, the decline is attributable in part to the Black Sea deal, but also to increased seasonal availability in Argentina and Brazil, where harvests proceeded faster than the previous year.
Use An API
You can see that the commodity market is not a static thing. With the sudden turns of the world situation, this market is undergoing several changes. That is why it is important to be attentive to trade relations between different countries and the development of the war. A privileged way to take all this into account to build accurate and solid statistics on this market is to use an API.
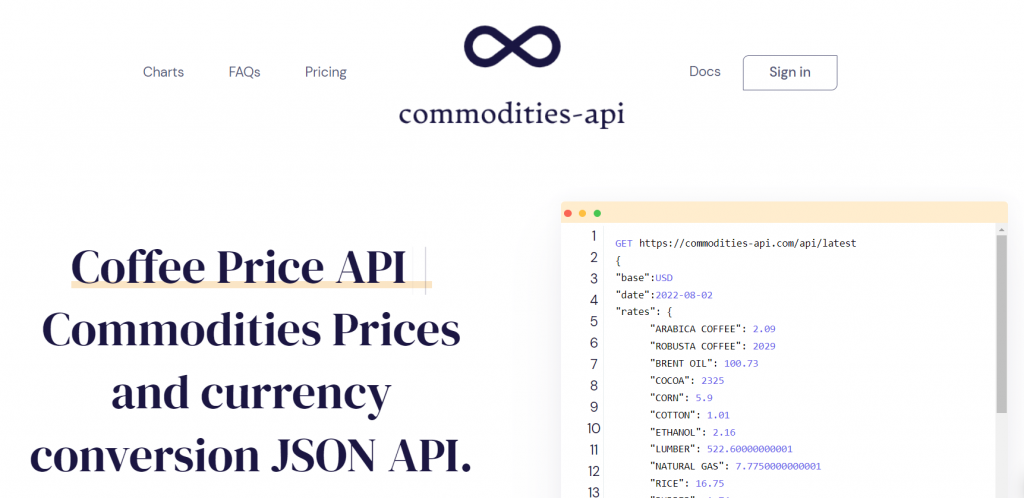
An API is a tool that distributes information between different devices. Programmers include them within websites to display up-to-date information. In this case, we will present you CommoditiesAPI which is the most professional tool to obtain this information.
Why CommoditiesAPI?
CommoditiesAPI allows you to compare the prices of different agricultural and refinery products in real-time. It has more than 170 products with current and historical prices. In this way, you can take into account the different factors that influenced this market and anticipate certain behaviors of the products.
You can see the prices in different international currencies to take into account what the price is in each country. It is important to take this into account because raw materials are the initial process of any production process.